Home » Expert Insights » Commerce Media Measurement Transparency Guide

Commerce Media Measurement Transparency Guide

Article authors: Chelsey Lang | Steve Baxter

Commerce media networks don’t calculate ROAS the same way, and most advertisers have no way to see that until results come in. Ovative’s Commerce Media Measurement Transparency Guide puts leading commerce media networks’ (CMNs) methodologies side by side, in their own words, so you can see exactly where a reported ROAS number comes from before you compare it to anything else. 

This is the first guide of its kind: a direct comparison of how commerce media networks handle cost models, attribution windows, identity matching, and more. Read it before your next budget conversation, before your next network review, or before you take a ROAS number at face value again.

Summary

Most advertisers still can’t compare how their budget performs with commerce media networks on an apples-to-apples basis. This guide exists to provide the industry with a shared reference point, comparing leading networks across a variety of measurement dimensions. Our first edition puts Albertsons Media Collective, Orange Apron Media, Instacart, and Walmart Connect side by side. With this guide in hand, marketers who plan, negotiate, or manage retail media spend can ask sharper questions of their media partners and make better media-buying decisions.
Why Commerce Media Measurement Inconsistency Demands Transparency

Retail media is approaching $90 billion in the U.S., and more than half of advertisers now use five or more commerce media networks.1 But most of those advertisers still can’t compare how their budget performs at those networks on an apples-to-apples basis. 

Varying, undisclosed methodologies risk advertisers shifting spend between networks based on reported ROAS numbers that were not built to be compared. The IAB and MRC have been working to standardize retail media measurement since 2024, and the ANA released its own framework in August 2026. We support that work. We also didn’t think advertisers should have to wait for it to finish before they could compare ROAS across networks. 

So we built what the industry needed ourselves: a commerce media measurement transparency guide. We asked participating commerce media networks the same questions about their cost model, attribution methodology, identity granularity, and more. We’re publishing what came back, in one place, exactly as each network answered it. 

This transparency guide is not a ranking of the methodologies used. We’re not naming a winner or a loser, and a network that discloses less isn’t necessarily doing anything wrong. It might measure differently, or it might not have an answer to share yet. Our job is to show you where the differences sit, so you can ask sharper questions with your media partners and make better media-buying decisions.

Retail media isn’t slowing down. Measurement should be able to keep up with it. This guide is one step toward that, and we plan to keep updating on pace with the industry. This first edition reflects the networks that responded to our initial outreach. And it’s just the beginning. If your network wants to be part of the next edition, let us know below. 

1 ANA, Retail Media Measurement Standardization (August 2026), citing eMarketer’s projection of 17% CAGR growth through 2028.

How to Use Ovative’s Commerce Media Measurement Transparency Guide

This guide is built for marketers and media leads who plan, negotiate, or manage retail media spend. If you’re deciding where budget goes next quarter or trying to explain to your CFO why one network’s ROAS is or isn’t comparable to another’s, start here.

Key Components of Ovative’s Commerce Media Measurement Transparency Guide

1. The Glossary: Every dimension in the grid is defined below. Check these definitions before you assume a term means what it means.

2. The Comparison Grid: Each column represents one participating commerce media network, and each row represents a measurement dimension. The grid is split into two placement types: Onsite Display and Onsite Sponsored Products. Navigate the grid by reading across rows to see how commerce media networks differ on that one dimension and by reading down a column to see one network’s profile. 

3. The Takeaway: The grid tells you where methodologies are similar and where they differ. The 11 questions below tell you what to do with that information. Bring these insights to your next conversation with any retail media partner, not just the ones in this guide. 

This edition includes the commerce media networks that responded to our first round of outreach. It’s a pilot cohort but not the full market. We built this guide to grow and expect to add more networks and dimensions to future editions. 

Glossary: Measurement Dimensions Covered and Methodology Definitions

The following definitions apply to every section of this guide, including the comparison grid and the 11 commerce media measurement questions every advertiser should ask commerce media networks.

1. Cost Model: How commerce media networks charge for media, using cost per click (CPC), cost per thousand impressions (CPM), or another pricing structure.

2. Impression Type: Whether reported impressions are served (delivered by the ad server, regardless of whether they were seen) or IAB viewable (met the IAB’s minimum visibility and duration threshold).

3. Attribution Window (Click): The number of days after a click within which a resulting sale is credited to the ad.

4. Attribution Window (Impression): The number of days after an impression (no click) within which a resulting sale is credited to the ad.

5. Attribution Methodology: The logic used to credit a sale to a media touchpoint. For example, last-click, last-view, or multi-touch models like linear, time decay, or position-based.

6. Identity Granularity: Whether sales are attributed at the individual level (only the exposed person’s purchase counts) or the household level (any household member’s purchase counts).

7. Product Set: The scope of products included in sales attribution, from the exact SKU advertised up through the full parent brand or umbrella portfolio. 

8. Non-Traceable Extrapolation: Whether the commerce media network estimates additional sales for shoppers it couldn’t match to an ad exposure, and if so, how. 

9. Reverse Transactions: How commerce media networks handle returns and refunds in reported sales, netted out immediately, partially deducted, or handled some other way. 

With the glossary as your reference, the comparison grid shows exactly where each network lands on every dimension.

The Commerce Media Measurement Methodology Comparison Grid

The full guide includes a side-by-side comparison grid for both Onsite Display and Onsite Sponsored Products, covering all nine measurement dimensions above for Albertsons Media Collective, Orange Apron Media, Instacart, and Walmart Connect. A few things to know before diving in: 

1. Every answer reflects what a network told us directly. If a cell is blank, that network chose not to answer that measurement dimension. We don’t fill gaps with assumptions, and we don’t guess on a network’s behalf.

2. The comparison grid is split into two. Onsite Sponsored Products and Onsite Display often behave differently even within the same network. We kept them separate rather than averaging them into one grid.

No two networks calculate attribution the same way. The comparison grids tell you where network methodologies are similar and where they differ. Next, use the questions below to inform better media buying decisions.

The 11 Commerce Media Measurement Questions Every Advertiser Should Ask Commerce Media Networks

ROAS appears like a simple calculation, but it isn’t. Every commerce media network makes a set of methodology choices before that metric is produced, and those choices can swing ROAS by more than 60%. Ask these questions of any commerce media network before you make assumptions about the metric you are utilizing.

1. What product set does the commerce media network use to attribute sales to a campaign: Product Hero, Advertiser + Category Halo, Advertiser Halo, or Umbrella Advertisers Halo?

2. How does the commerce media network support advertisers with lower sales velocity, whose ROAS is naturally disadvantaged by this choice?

3. What’s the commerce media network’s match rate between your transaction records and their identity resolution partner? Is it household or customer level?

4. What’s your campaign’s media match rate to that same identity resolution partner or media platform?

5. How does the commerce media network extrapolate for untraceable sales? Is my brand or category more susceptible to untraceable sales at your retailer?

6. Does the commerce media network use IAB viewable impressions only? If it uses served impressions instead, what percentage of your media was viewable by users?

7. What attribution approach does the commerce media network use to credit sales to media touches?

8. Can a single sale or transaction be attributed to more than one campaign or channel?

9. Does the commerce media network attribute sales at the household level or the customer level?

10. Can you influence product attribution set, extrapolation, viewability, media attribution, or household/customer attribution when you set up a campaign?

11. Can any of those approaches change after the campaign ends?

Eleven questions, one goal: knowing exactly what you’re comparing before you compare it. Ask these of any commerce media network, not just the ones in this guide. 

Want to learn more? Dive deeper into this conversation in our reports: 

Retail Media ROAS Demystified: A Guide to Understanding Your Brand’s ROAS 

Retail Media iROAS Demystified: A Guide to Understanding Your Brand’s Incremental ROAS 

Frequently Asked Questions (FAQs)

Q1: How was Ovative's Commerce Media Measurement Transparency Guide created?

A: We invited several major retail media networks to participate. Every network received the same set of questions under the same terms and followed a defined response process. This edition reflects the completed responses we received by our stated deadline. Networks that chose not to respond aren't named. We don't identify non-participants, and we don't speculate on why a network chose not to respond. 

Responses are published as-is. We don't edit, interpret, or fill in what a network didn't answer. Where a network declined to answer a specific question, that's shown as a decline, not left blank or guessed at. 

Each participating network signed a legal release authorizing Ovative to publish their responses verbatim and attribute them to their organization. That release carves out an explicit exception to any existing confidentiality agreements between Ovative and the network, so responses can be shared publicly without conflict. Participation is voluntary and unpaid, and submitting a response creates no partnership or obligation beyond what's stated in the release. 

Q2: Will Ovative's Commerce Media Measurement Transparency Guide be updated in the future?

A: This guide will refresh on a regular cadence to reflect methodology changes and welcome new participants.

Q3: Why would my network want to take part in future editions of Ovative's Commerce Media Measurement Transparency Guide?

A: There are many reasons why a network should take part in the guide:

1. Advertisers trust numbers they can understand. And when advertisers trust the numbers, they invest more. Disclosure helps a network earn the budget.

2. You answer in your own words. Responses are published verbatim. Ovative does not edit, critique, or validate them.

3. No ranking, no "best." The guide shows answers side by side with no scores, standards, or judgment. It gives brands a common language, which is the stated goal of the guide. 

4. You choose what to disclose. Most questions offer "Decline to Respond" and "Other," and networks can leave out anything confidential or proprietary. 

5. You sit inside the industry conversation. The IAB, MRC, and ANA are working on standards. Participating networks show where they stand today while that work continues. 

Q4: What should I expect as a network in future editions of Ovative's Commerce Media Measurement Transparency Guide?

A: Participation in this guide is a four-step process:

1. Align. Confirm who owns the decision and who approves public disclosure.

2. Answer. Complete the questionnaire for two onsite channels, Display and Sponsored Products.

3. Review. Check every answer and see the finished guide before it goes live. 

4. Release and share. Your answers are published on this landing page.

Q5: How can my retail media network get added to future editions of Ovative’s Commerce Media Measurement Transparency Guide?

A: If your network wants to be included in a future edition, contact us below.

Ready to Put This Into Practice?

ROAS only means as much as the methodology behind it. With the questions and comparison grid in this guide, you can walk into your next budget conversation or network review knowing exactly what’s driving the number in front of you, instead of taking it at face value. 

This is the first edition of a guide we plan to keep building as new networks join. Here’s how to stay in the loop for the next edition:

For Brands: Want to know when the next edition drops or talk to us about how to bring these questions to your network? Sign up below.

For Networks: The networks in this guide told advertisers exactly how their numbers work. If you want in on the next edition, use the form below and we’ll follow up directly. 
Name(Required)
I am signing up to:(Required)
Optional: By checking “I understand”, you give Ovative Group permission to use this information to share Ovative’s future news and event opportunities. You may unsubscribe from these communications at any time. For more information, please review our privacy policy at https://ovative.com/privacy-policy/.

AI continues to shift how your customers are discovering your brand.  

As the space has rapidly evolved, many are left feeling in the dark as to what’s actually happening at scale on AI search platforms. How does my brand show up in AI, and what can I do to optimize? Is it true that AI platforms aren’t linking out to websites? What sources are AI platforms trusting? Is AI deciding my brand’s positioning for me?  

We’ve heard versions of these questions asked by our clients, our leaders, and ourselves. We sought to answer them in a classically Ovative fashion: by looking at the data. 

The Dataset Behind Our Retail AI Visibility Analysis

As an AI and search optimization partner for many leading enterprise retailers, we have unique insight into a large volume of prompts specific to the retail industry. Our dataset includes:

  • 1,087 unique prompts analyzed over a 9-week window 
  • 37,783 model responses tracked across ChatGPT, Claude, Gemini, and AI Mode
  • 422,998 total citations 

Armed with this data, we set out to better understand how retailers show up in AI responses by analyzing the following segments: 

  • Prompt Types: How brands show up and models populate responses across Informational, Consideration, and Transaction prompts.
  • Model Types: Understanding if AI platforms more frequently respond with information from underlying models (Model Knowledge) or if they are actively retrieving live information (Search Augmented).
    • This is critical insight as only Search Augmented responses will include citations and provide traffic-driving opportunity.
  • Brand Mentions: How brands are mentioned and positioned in AI responses, and how that differs across platforms and prompt types.
  • Cited Content Types: Which sources, content types, and content signals are most trusted by AI platforms. 

With this insight, we can better understand how AI systems tick, and ultimately, leverage these insights to drive more effective AI search optimization strategies. This study is part of an ongoing series from our team on industry-specific AI visibility.

Key Findings: What Our Retail AI Search Analysis Revealed

  1. Across our retail dataset, 80% of tracked prompts provided a Search Augmented response with citations. This means that most AI responses in retail contain links, providing traffic-driving opportunities.
  2. Editorial content is critically important as nearly half of all retail AI Citations are either product recommendations or long-form content.
  3. Most AI brand mentions are not endorsements; they’re just mentions. We expected to see less neutrality but the reality is that only 25% of AI responses were actively recommending a brand. 

1. AI Citations Are More Common Than You Think, and That’s Good News for Retail Traffic

Finding 1: 80% of our tracked prompts returned Search Augmented responses, meaning that AI models are more frequently providing citations and therefore traffic-driving opportunity for retail brands.  

Why This Matters

Model response is the gate that citations sit behind, and it’s up to the AI models themselves how they choose to respond. Brands have no control over that. Without Search Augmented responses, citations don’t exist. And when citations don’t exist, there is no link for users to click on AI responses.  

Businesses are fundamentally dependent on citations to drive measurable performance in AI. It’s encouraging to know that the underlying models are constructed in a way, at least for now, where AI can still be a viable performance-driving channel.  

In our dataset, we did note some differences across different prompt types and model responses: 

  1. The further down the funnel you go, the greater the likelihood of citations. This is logical, as the more specific and conversion-oriented you are, AI responses are weaving in a large variety of different sources, and in the retail sector, lots of products and category pages are being cited. 
  2. Gemini is the one platform playing a different game than the others. Across informational prompts, other AI platforms respond with a Search Augmented response 89-100% of the time. Gemini does it 35% of the time, the rest is being answered from model knowledge alone.  

Regardless of some of the model nuance, this is great news for brands looking to leverage AI to drive lower-funnel, high conversion intent traffic. Here’s a further breakdown of what we saw in our retail dataset:

Prompt Type  % Search Augmented % Model Knowledge  Platform Differences (% Search Augmented by engine)
Informational 78.9% 21.1%
  • Gemini lowest at 35% Search Augmented
  • Claude ~100% Search Augmented
  • AI Mode/ChatGPT both ~90% Search Augmented 
Consideration 81.8% 18.2%
  • Gemini rises to ~50% Search Augmented but still trails the rest by 40+ points
  • Claude still ~99% Search Augmented 
Transactional 84.2% 15.8%
  • Gemini peaks here at ~51% Search Augmented but remains the outlier
  • Claude hits 100% Search Augmented
  • AI Mode highest of the “big three” at ~97% Search Augmented 

What This Means for Your AI Search Strategy

 While AI certainly behaves differently than traditional search, the notion that AI does not create opportunities to drive traffic is categorically false. 

Continue to prioritize your AI visibility and performance optimization efforts by: 

  • Improving site accessibility. Ensure your site is allowing AI bots and agents to access your content, and that your content properly renders. 
  • Optimizing your content for conversational relevancy and quality. Target phrases, questions, and concepts throughout your site that map back to what your primary audiences are asking AI for. 
  • Building offsite brand authority. It’s time to dust off that old PR playbook. Boost authority by building high-quality brand mentions and links in sources highly trusted by AI platforms. 

 While the landscape of AI results is shifting, know that the opportunities to drive performance from AI platforms are very much there.   

2. Nearly Half of AI’s Retail Citations Go to Content Most Retailers Aren’t Investing In

Finding 2: Editorial content is critically important as nearly half of all retail AI Citations are either product recommendations or long-form content. 

Why This Matters

Understanding what domains and page types are being cited in AI platforms help us understand the content sources AI trusts, providing critical insight on where and how to publish content to increase visibility.

Chart showing types of AI citations based on retail research report

Expertise and Clean Structure Are What Earn AI Citations

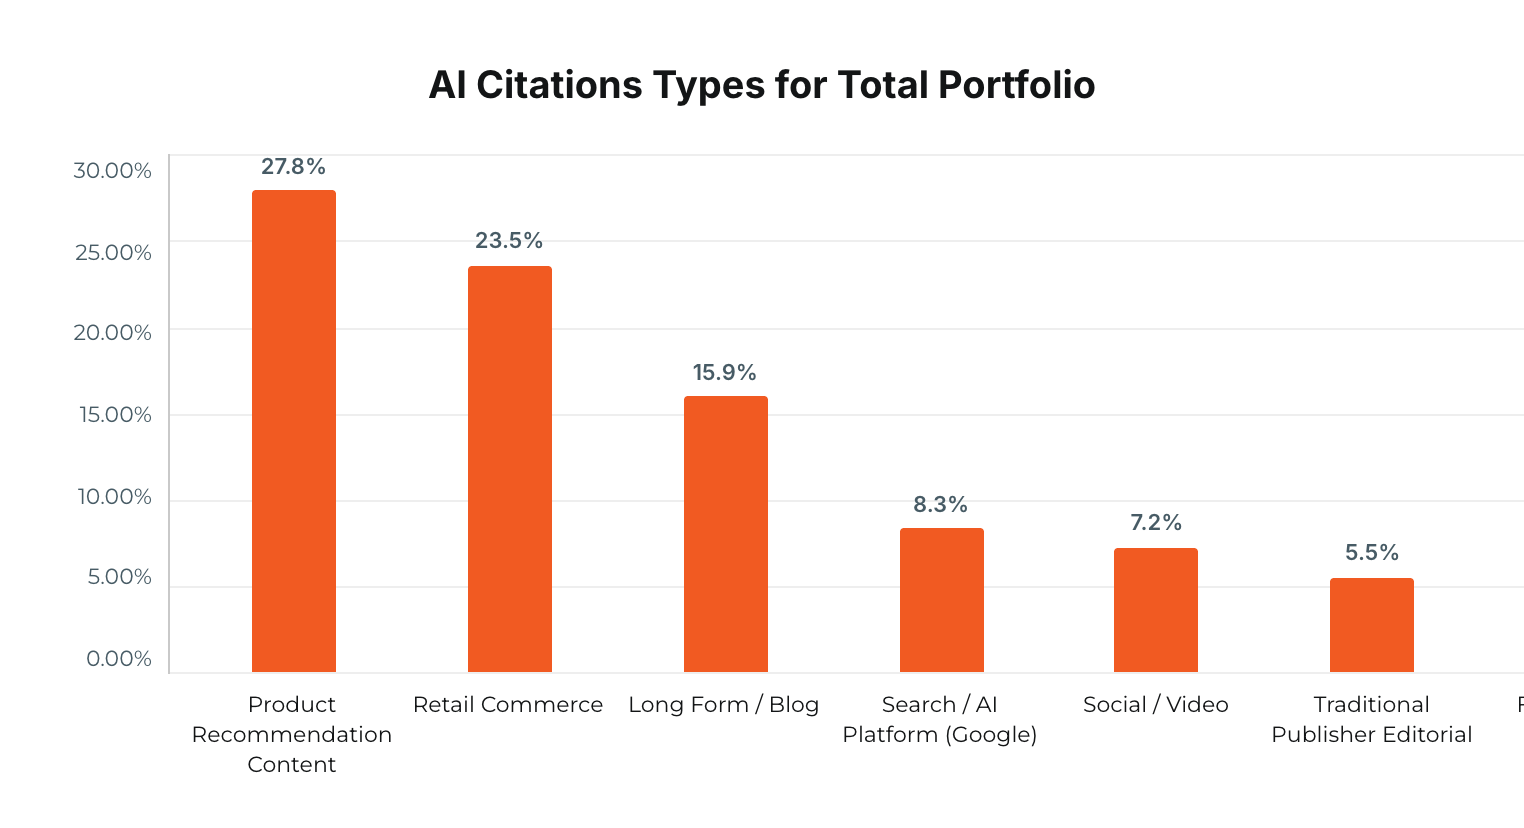
Product recommendation content is the largest cited content type, accounting for 28% of citations. This content is classified as product ranking and recommendation content, with the overwhelming majority being affiliate content. Publishers cited most frequently for product recommendation content both had expertise in the category, and structured their content in a way that is easy for AI crawlers to read and trust, explicitly including 2026 or ‘best for’ language within them. A few sites winning in the space are WhoWhatWear, Forbes, and Business Insider. Their mix of expertise and trust built within their long-form articles combined with their product recommendation content make them a trusted source in AI’s eyes leading to their success in the space. 

Long-form content made up 16% of total citations, inclusive of informational blog content. Within cited long-form content, expertise shines through as a trustworthiness signal to AI. Cited content was largely from hubs from category expert blogs and guides like REI and Whirlpool. Unsurprisingly, informational prompts were the largest prompt category, making it important for retailers to portray their expertise and understanding for customer questions and needs by creating this content.   

Transactional prompts overwhelmingly drove to Retail Commerce pages, largely from “where to buy…” prompts. ChatGPT cites the largest quantity of pages, which are primarily store location pages that pull from an interactive map with some specific product recommendations that cite PDPs. Other platforms like Gemini and AI Mode largely cite top rated PDPs with shoppable experiences, signaling the eventual shift to and integration of a truly agentic model.  

YouTube and Reddit are often referenced as top citation sources. By domain this may be true as they come in second and third, but social and forum citations only make up 7% and 4% of total citations respectively. Additionally, we saw Reddit citations decline -1% from June to July, driven by ChatGPT and AI Mode. Volatility has continued as Reddit citations saw declines in August across the industry. Claude over-indexes in social and forum citations, with 13% social citations and 6% of citations attributed to forums, followed by AI Mode. Other content types also made up a small share of total citations.  

What This Means for Your AI Search Strategy

The data is clear: content wins in AI search. To increase visibility, investing in product recommendations, offsite content, and building helpful content on your site will help build authority and trust with AI platforms and customers.  

Other page types, such as traditional retail page types, are being cited within platforms on prompts with high intent, so it is important to keep pages well maintained to capture users at the bottom of the funnel. 

Actions your brand can take to optimize include:

  • Invest in product recommendation content. Partner with affiliate teams to invest in buys with highly cited and authoritative publishers within your industry.
  • Prioritize traditional e-commerce pages. Don’t forget about keeping core e-commerce pages follow search ongine Optimization (SEO) best practices, including helpful product descriptions and copy blocks on product landing pages (PLPs).
  • Build industry-relevant long-form content. Showcase expertise by creating blog content that is highly relevant to your industry and answers the specific questions users are searching AI platforms to solve. 

3. AI Is Far More Neutral About Brands Than Marketers Assume

Finding 3: With only 25% of AI responses actively recommending a brand, most AI brand mentions are not endorsements, they’re just mentions. 

Why This Matters

There’s a common belief across marketers that AI platforms are influencing consumer opinions significantly in their responses, and while that may be true in some contexts, it appears far less frequently in retail. 

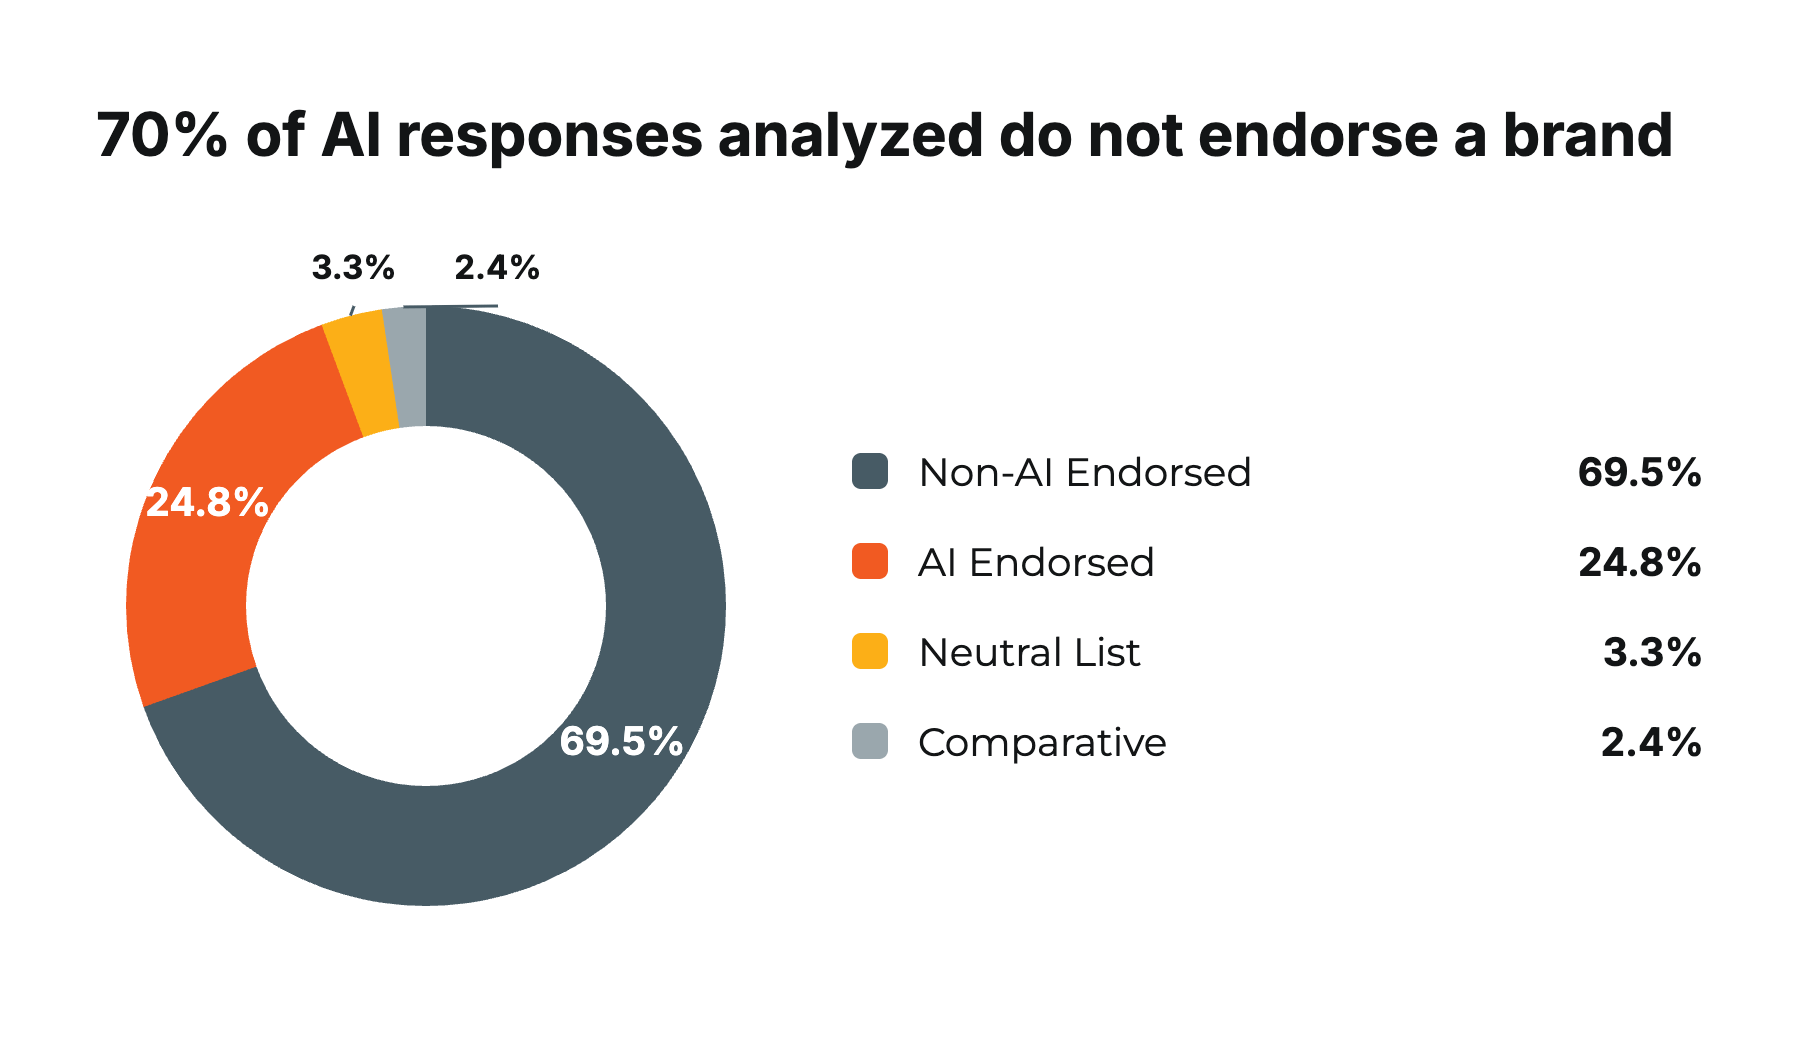
Of the 220k brand mentions in our dataset, 70% of brand mentions contained no evaluative or endorsement language at all.   

Chart with data on AI search visibility by funnel stage

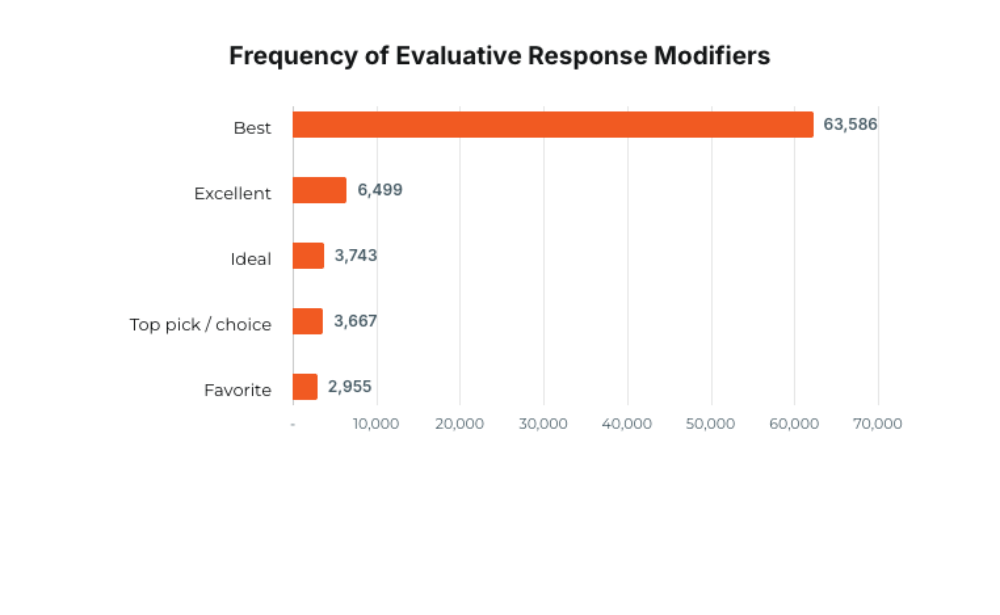
Only 25% of responses included active recommendation language like ‘best’, ‘top pick’, ‘stands out’, ‘award winning. Claude led the pack with strongest endorsement rates at 38%, ~2.5x higher than AI mode, which was the most neutral of the bunch. 

chart showing the frequency of evaluation modifiers from AI retail report

What This Means for Your AI Search Strategy

It’s important to understand that while AI platforms certainly help consumers evaluate options and make purchasing decisions, they are far more neutral than you likely expect.  

Regardless, track important informational, consideration, and transactional prompts, and watch what AI is saying about you. Analyze AI responses to understand the tone and nature in which your brand is referenced, especially in the context of competitors. If you have work to do, focus efforts on creating authoritative content and securing mentions from authoritative third-party sources, then track changes in AI responses. 

While this is likely to change as models evolve, it’s encouraging to understand that AI platforms provide a more level playing field as of right now. 

AI Search Stops Being a Mystery Once You Have the Data

So what does this all add up to? AI search isn’t the black box it can feel like. It’s a channel with real rules, real nuance, and as we’ve shown across more than 37k responses, real opportunity for brands willing to meet it on its terms. 

The throughline across all three findings is the same: citations aren’t rare, content quality is what earns them, and AI platforms are still remarkably neutral about who they surface. That combination is critical insight for brands optimizing today. 

Bring it back to fundamentals: keep your site accessible to AI crawlers, build content that actually answers what your customers are asking, and invest in the kind of offsite authority that gets you cited, not just mentioned. Do that, and AI search stops being a mystery and starts being a growth channel. 

This is only the first of our industry-specific AI visibility studies, and we’ll keep digging as the space evolves. Have questions about what this means for your brand specifically? Let’s talk. 

Ready To See How Your Brand Shows Up in AI Search?

Ovative’s search experts take a holistic approach that considers organic search, SEM and AI visibility as a connected system. 

Solutions for AI readiness include site structure work, content planning for LLMs, and effective measurement frameworks. Contact Ovative to get started with an audit of your current AI visibility.

SHARE

ARTICLE AUTHORS

  • Chelsey Lang

    Chelsey Lang

    Director, Retail Media Measurement

    Chelsey is the Director of Retail Media Measurement at Ovative Group, where she leads the charge in unlocking new insights and impact from retailer data. A natural problem solver and data detective (with elite reality TV knowledge), Chelsey brings a “just do” attitude to driving innovation, challenging traditional media measurement, and making work more fun.

  • Steve Baxter

    Steve Baxter

    EVP, Retail Media

    Steve is known for redefining the box instead of just thinking outside it. His "what if" mindset drives him to solve our clients' toughest measurement challenges and set the pace for the industry. As EVP of Retail Media, he leads a team of change-makers who take on that challenge daily, driving profitable growth for clients.